Interactive ECG
Learn ECG interpretation by finding the abnormality yourself.
Work through 50 recorded PTB-XL patterns plus sixteen precision labs for highlighting, lead localization, and calibrated measurement.
✓ Recorded 12-lead SVG waveforms✓ Source attribution✓ No registration required
Synthetic case · T-wave changes02 / 04
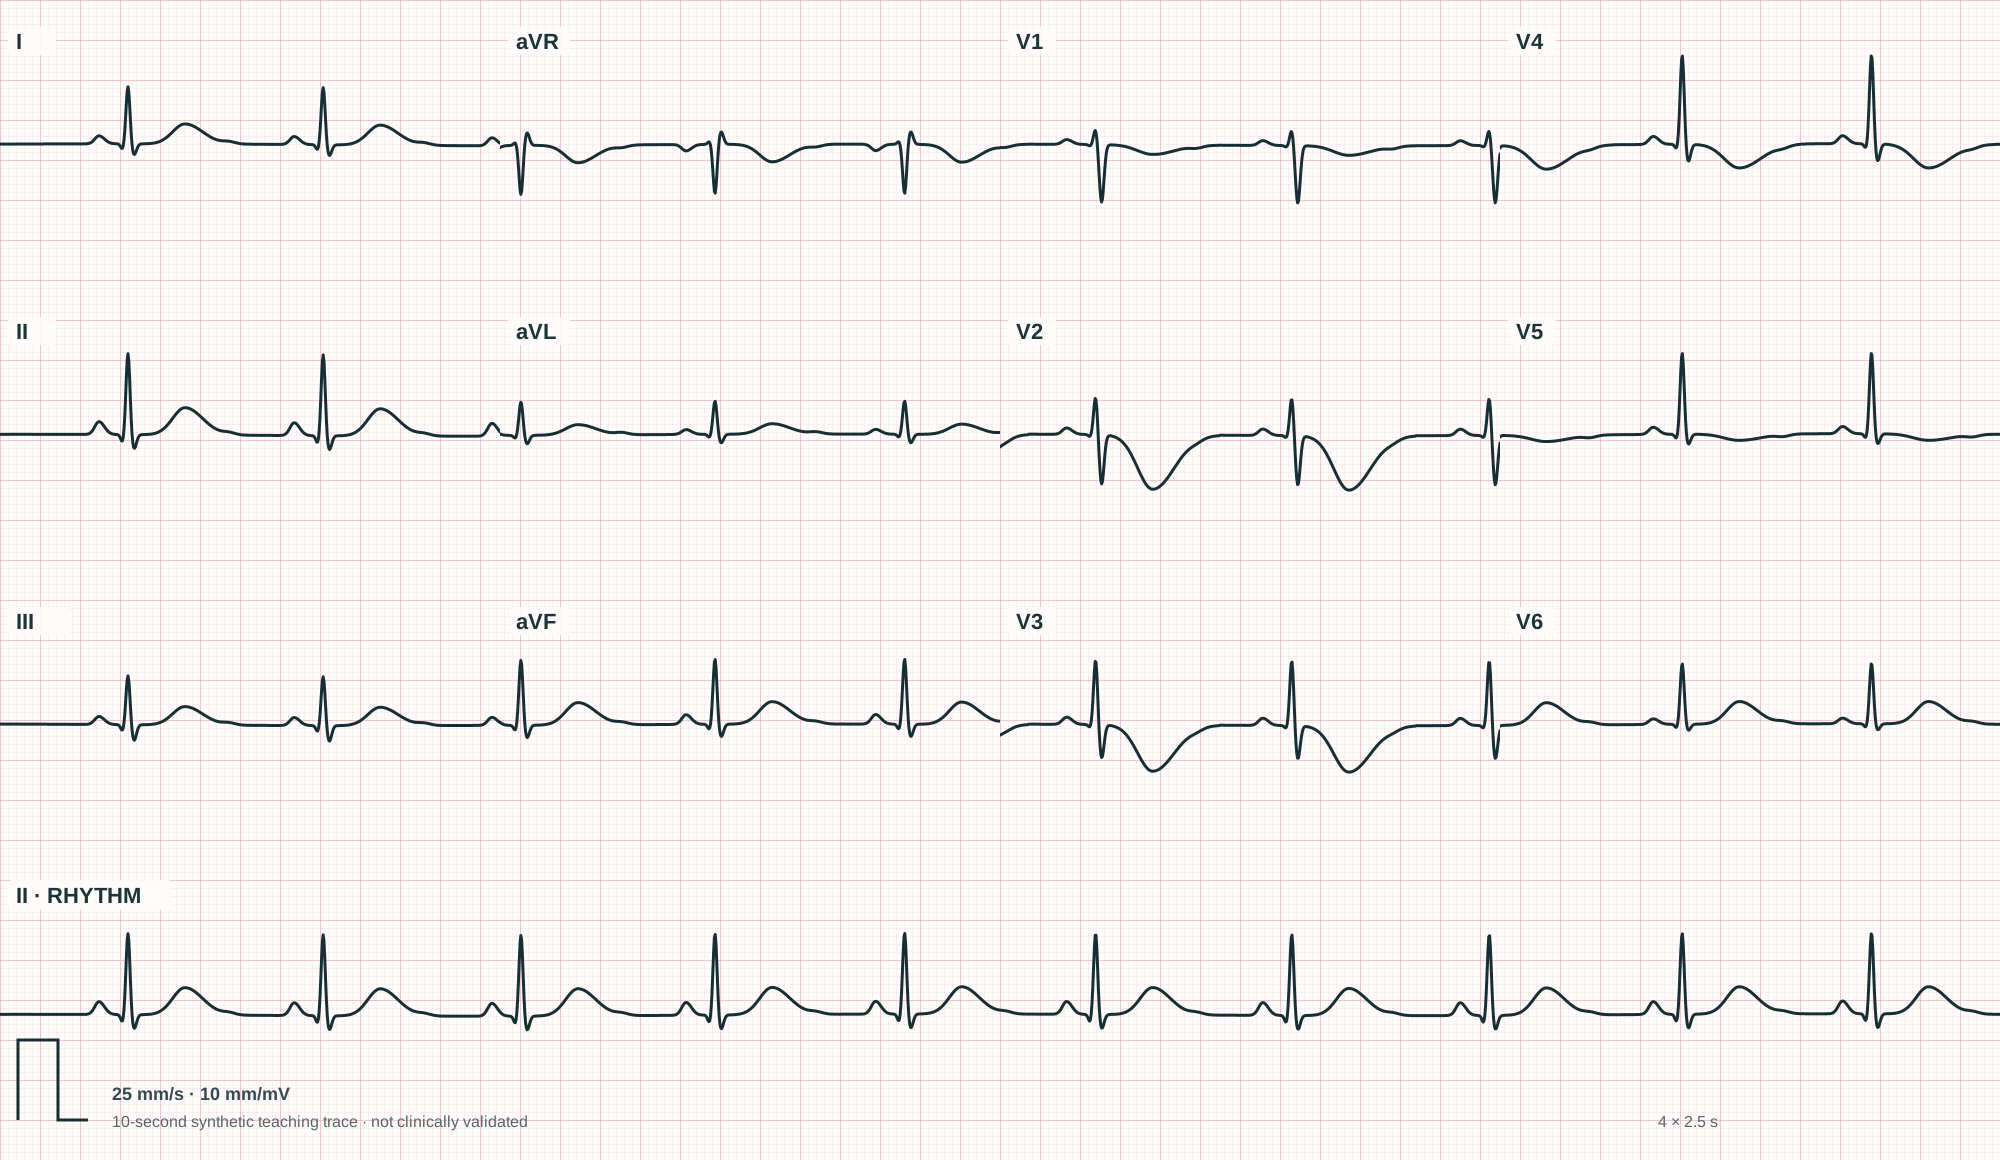
V2
V3
FIND THE ABNORMALITYHighlight the abnormal T waves.
▧ Region toolPoint & highlightShow exactly what you see
MeasureUse calibrated digital calipers
InterpretConnect morphology to diagnosis